
Sweeps
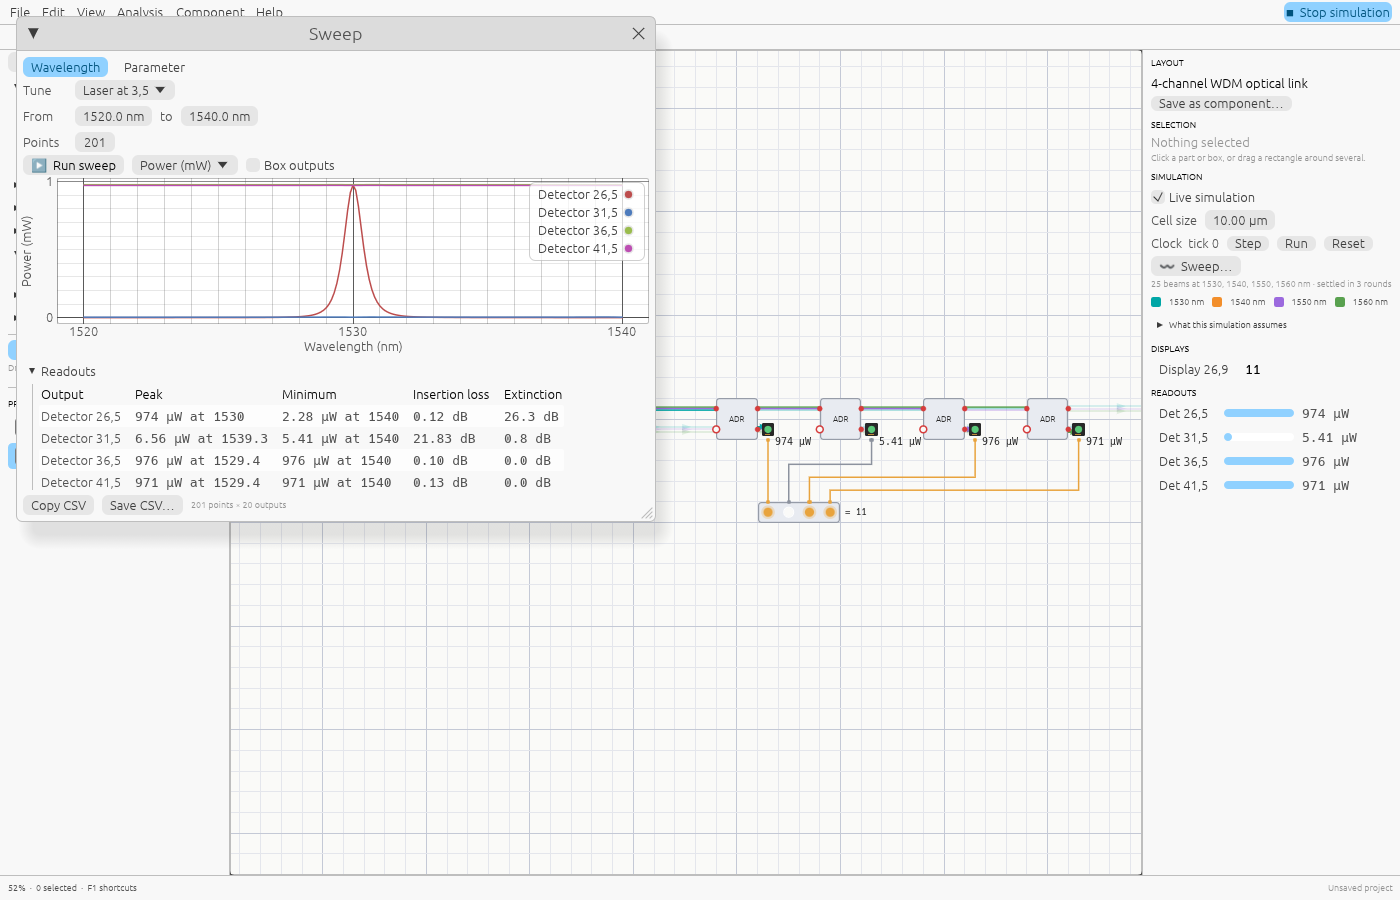
A sweep simulates your design many times while one thing changes, and plots the power at every output. Use it for spectra (a ring’s resonance, a filter’s passband, a WDM link’s channels) and for tuning (how a phase shifter steers an interferometer, where a coupler reaches critical coupling).
Opening a sweep
- Inspector → Simulation → Sweep…: sweeps the selected part, or the first laser.
- Right-click a laser, phase shifter, attenuator, beam splitter or a waveguide block → Sweep…
- Analysis → Sweep… in the menu bar.
Selecting a laser sets up a wavelength sweep around its wavelength; selecting anything else sets up a parameter sweep over its first parameter.
Wavelength sweeps
Pick the laser to tune and the range in nm. The laser steps through the range; everything else stays as it is. This is how a tunable laser measures a device’s spectrum.
Parameter sweeps
Pick a part (Use selection) and one of its parameters, and the range:
| Part | Parameters |
|---|---|
| Laser | power (mW), phase, wavelength |
| Beam splitter | reflectivity |
| Phase shifter | phase |
| Attenuator | transmission |
| Directional coupler | coupling |
| Phase shifter / attenuator blocks | phase / loss (dB) |
| Delay line | length, n_eff |
| MZI switch | θ, φ |
| Ring, add–drop ring | coupling, length, n_eff, loss (dB/cm) |
Reading the plot
Every detector and output port is a curve, named by its label or its position. Tick Box
outputs to also plot the light leaving every block and component (Add–drop ring 24,4 out2); they’re shown anyway when a design has no detectors. Click a name in the legend to
hide or show it.
The scale menu plots Power (mW), Power (dBm), or Relative to input (dB): each
output over the input power, which is the tuned laser’s for a wavelength sweep and all
lasers’ for a parameter sweep. That’s the transmission spectrum engineers quote. Scroll to
zoom and drag to pan the plot; double-click resets it.
Readouts
Under the plot, a table gives for every curve shown:
| Readout | What it is |
|---|---|
| Peak | highest power, and the swept value where it occurs |
| Minimum | lowest power, and where |
| Insertion loss | input over peak power, in dB: what the best path loses |
| Extinction | peak over minimum, in dB: how deep the switching or notch is |
In the add–drop ring example, the drop port’s insertion loss is about 0 dB at resonance, and the through port’s extinction is over 20 dB.
Each point is a full simulation: light and electronics settle together, and components are simulated through. Coarse sweeps (tens of points) are instant; thousands of points on a big design take a few seconds.
Exporting
Copy CSV puts the data on the clipboard, ready to paste into a spreadsheet. Save CSV… writes a file (in the browser, it downloads). The first column is the swept value; then one power column (mW) per output.
A link can open a sweep directly: ?example=4-channel-wdm-optical-link&sweep opens the
example and runs a sweep of its first laser.